Operating Cost & Performance Analysis Template for Excel
Analyze operating costs across multiple revenue tiers with this free Excel template. Compare advertising, PR, admin, and transportation costs as a percentage of revenue. No signup required.
Free
No signup
Excel
Business
2026-07-12
What Is This Operating Cost Analysis Template?
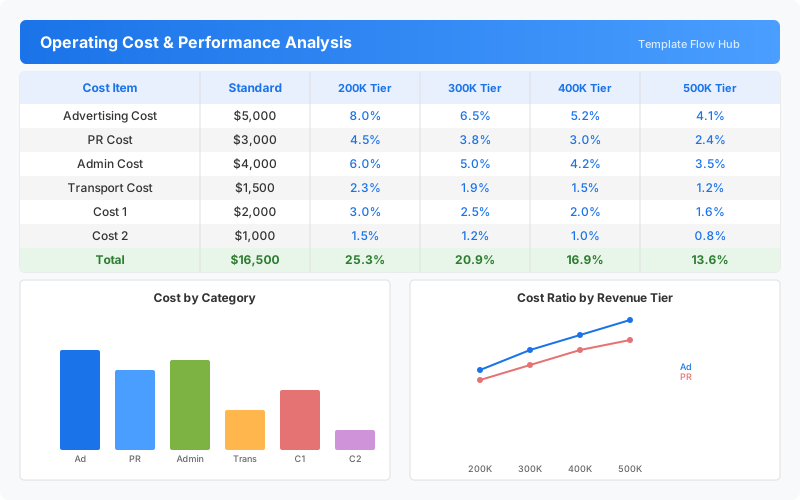
This operating cost analysis template is an Excel workbook for breaking down business expenses and measuring how each cost category performs across different revenue tiers. Enter your cost items and standard amounts, and the template automatically computes the percentage of revenue for each tier, helping you understand how your cost structure scales.
Why Use a Google Sheets Operating Cost Analysis Template?
Understanding how costs behave at different revenue levels is essential for pricing, budgeting, and scaling decisions. This template gives business owners and financial analysts a clear view of which expenses take the largest share of revenue and how those ratios improve—or worsen—as revenue grows. The built-in charts make it easy to spot trends and outliers at a glance.
When Should You Use This Operating Cost Analysis Template?
Use this template during quarterly financial reviews, budget planning sessions, or when evaluating the financial impact of scaling your operations. It is especially useful for startups and growing businesses that need to track how operating leverage changes as they reach higher revenue milestones.
What's Included
- ✓Cost item breakdown with categories
- ✓Cost standard reference values
- ✓Performance ratio calculation across multiple revenue tiers
- ✓Automatic percentage computation for each cost category
- ✓Visual bar chart of costs by category
- ✓Trend line chart of cost ratios by revenue tier
How to Use This Template
Who This Template Is For
Available Formats
Excel (.xlsx) — Download the file and open it in Microsoft Excel, Apple Numbers, or any compatible spreadsheet application.
Customization Tips
- 💡Add or remove cost rows to match your business expense structure.
- 💡Adjust the revenue tier labels to match your actual revenue brackets.
- 💡Use conditional formatting to highlight cost categories exceeding target ratios.
- 💡Extend the analysis with additional revenue tiers for more granular tracking.
Use Cases
- Operating cost structure analysis
- Revenue tier performance benchmarking
- Cost ratio trend monitoring
- Budget vs. actual cost comparison
- Business expense optimization planning
Download or Copy
Frequently Asked Questions
Related Templates
Last updated: 2026-07-12